

This little feedback to find the most suitable chart display card.
I will compare the maps to show the outside temperatures.
history-graph
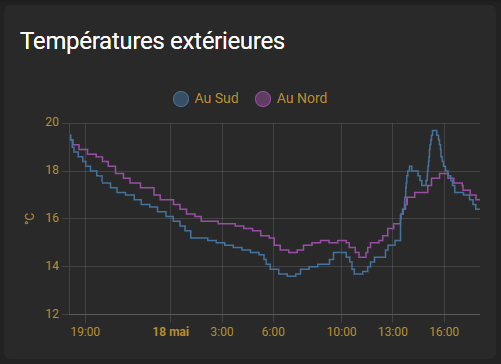
type: history-graph title: Outdoor temperatures hours_to_show: 24 entities: - entity: sensor.temperature_external _sud _temperature name: South - entity: sensor.temperature_external _nord _temperature name: To the North
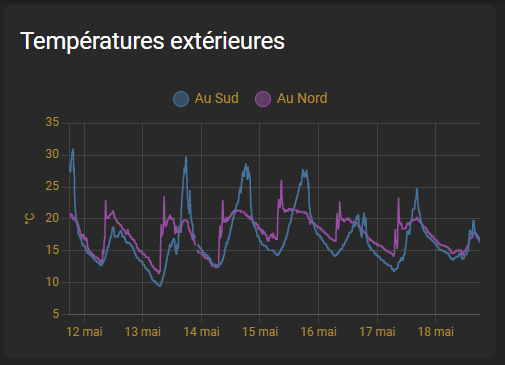
type: history-graph title: Outdoor temperatures hours_to_show: 168 entities: - entity: sensor.temperature_external _sud _temperature name: South - entity: sensor.temperature_external _nord _temperature name: To the North
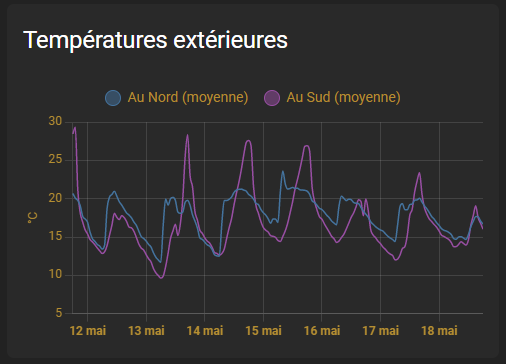
custom:apexcharts-card
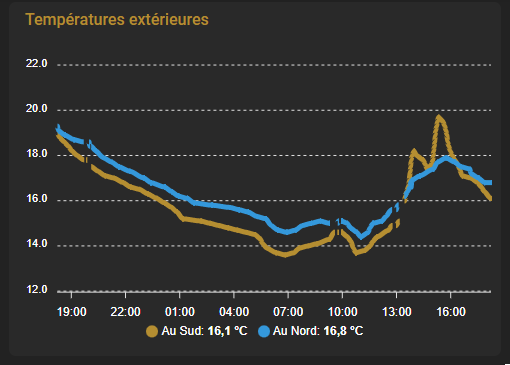
type: custom:apexcharts-card header: show: true title: Outdoor temperatures graph_span: 24h series: - entity: sensor.temperature_external _sud _temperature name: South - entity: sensor.temperature_external _nord _temperature name: To the North
type: custom:apexcharts-card header: show: true title: Outdoor temperatures graph_span: 7d series: - entity: sensor.temperature_external _sud _temperature name: South - entity: sensor.temperature_external _nord _temperature name: To the North
Observation on this map: latencies sometimes very painful even on very simple graphs.
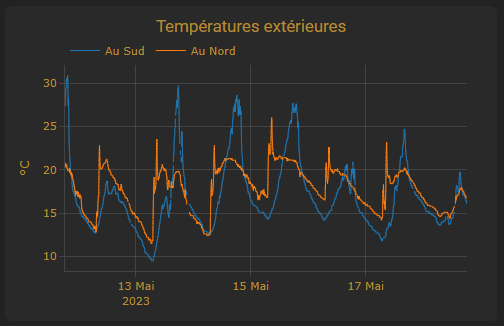
custom:plotly-graph
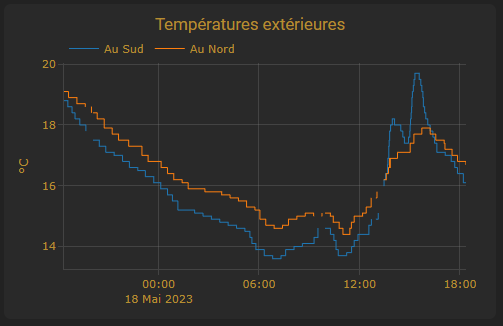
type: custom:plotly-graph entities: - entity: sensor.temperature_external _sud _temperature name: South - entity: sensor.temperature_external _nord _temperature name: North hours_to _show: 24h title: Outdoor temperatures
type: custom:plotly-graph entities: - entity: sensor.temperature_external _sud _temperature name: South - entity: sensor.temperature_external _nord _temperature name: North hours_to _show: 7d title: Outdoor temperatures
Observation on this map: rather responsive, very nice and fast customizable buttons.
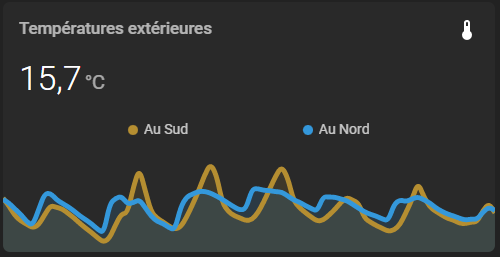
custom:mini-graph-card
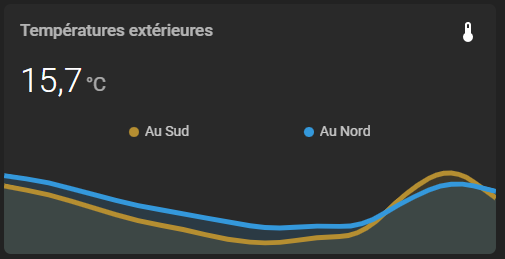
type: custom:mini-graph-card name: Outdoor temperatures entities: - entity: sensor.temperature_external _sud _temperature name: South - entity: sensor.temperature_external _nord _temperature attribute: temperature name: To the North
type: custom:mini-graph-card name: Outdoor temperatures entities: - entity: sensor.temperature_external _sud _temperature name: South - entity: sensor.temperature_external _nord _temperature attribute: temperature name: North hours_to _show: 168
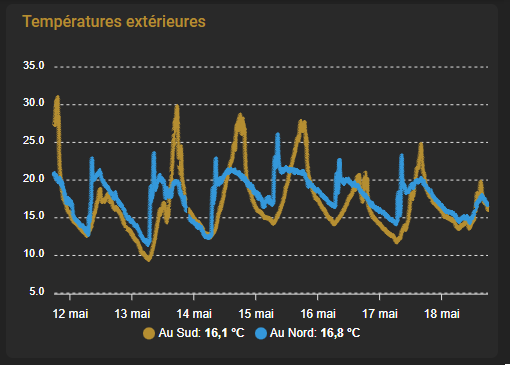
statistics–graph
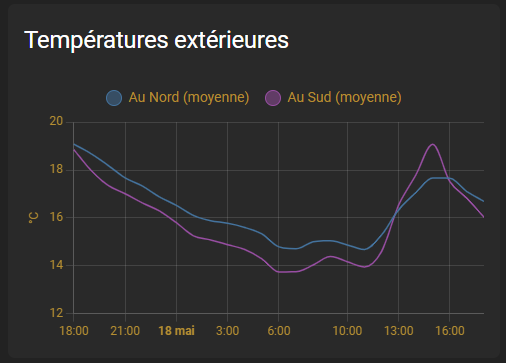
type: statistics-graph title: Outdoor temperatures days_to _show: 1 stat _types: means entities: - entity: sensor.temperature_external _sud _temperature name: South - entity: sensor.temperature_external _nord _temperature attribute: temperature name: To the North
type: statistics-graph title: Outdoor temperatures days_to _show: 7 stat _types: means entities: - entity: sensor.temperature_external _sud _temperature name: South - entity: sensor.temperature_external _nord _temperature attribute: temperature name: To the North
Observation on this map: an option for a very nice slight gradient.
custom:history-explorer-card
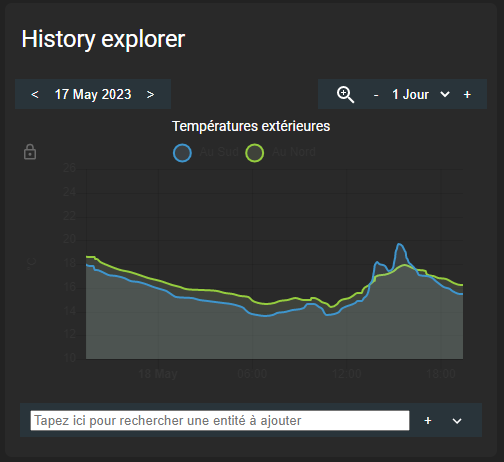
type: custom:history-explorer-card graphs: - type: line title: Outdoor temperatures entities: - entity: sensor.temperature_external _sud _temperature name: South - entity: sensor.temperature_external _nord _temperature attribute: temperature name: To the North
Observation on this map: I did not go very far in the essays on this map, it seems archi complete and the doc is very long.
 English
  French
  Spanish
  Chinese
  German